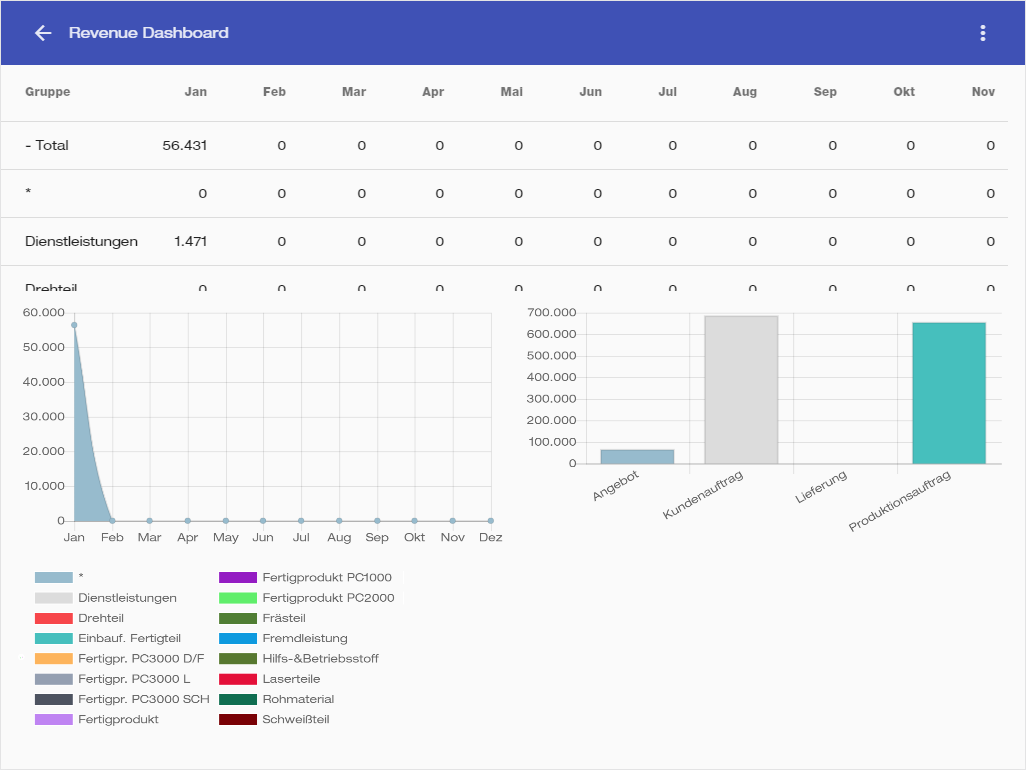
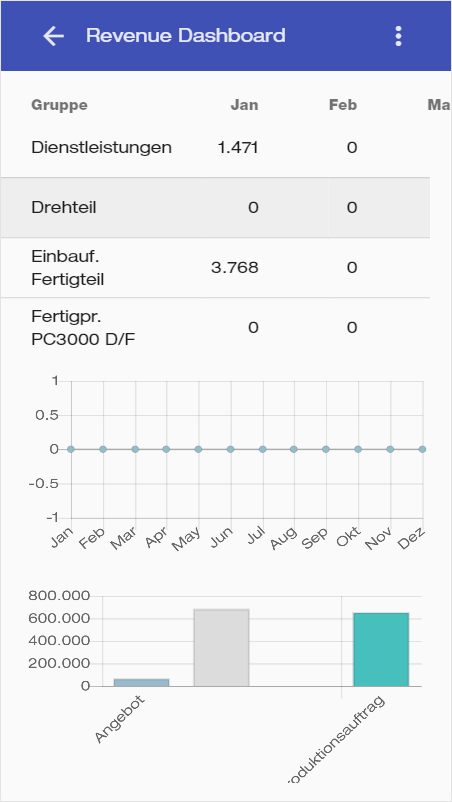
This interface displays a dashboard containing information about item production throughout the year.
Usage
-
Simply browse through the list and charts, toggling their display by clicking the respective bar graphs' labels.
-
The charts will indicate the amount of items that have been produced through an amount of time.